 |
In 2001 the SoundPLAN developer implemented the FHWA Traffic Noise Model (TNM ™). In 2006 SoundPLAN finalized the implementation of the TNM 2.5 noise emission and noise prediction methodology. SoundPLAN is in contact with FHWA and Volpe to resolve the difference that still remain in the noise prediction calculation. FHWA developing TNM v3.0. The Volpe Insititue works on the acoustic kernel and a software house provides the user interface. As part of the TNM v3 release FHWA developed a noise modeling Consistency Test. SoundPLAN implemented the TNM v3 changes. In early 2015, SoundPLAN started to process the Consistency Test. The requirements of the Consistency Test is to be within +/- 0.25 dB of the TNM v3 benchmark results. Unfortunately SoundPLAN found that the result could not be used as benchmark. As soon as the results of the Consistency Tests are updated by FHWA SoundPLAN will continue with the consistency test. Note: The Federal Highway Administration Traffic Noise Model (FHWA TNM™) is protected by U.S. copyright laws. The noise prediction methodology used in SoundPLAN has been designed to be consistent with the FHWA TNM (TM), however, SoundPLAN has not been tested, evaluated, or approved for use by any Agency of the U.S. Government. |
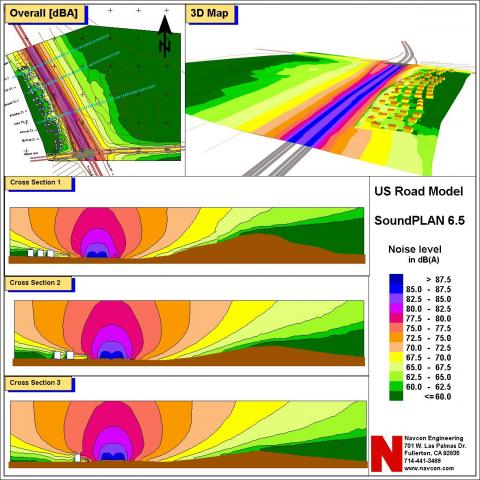 |
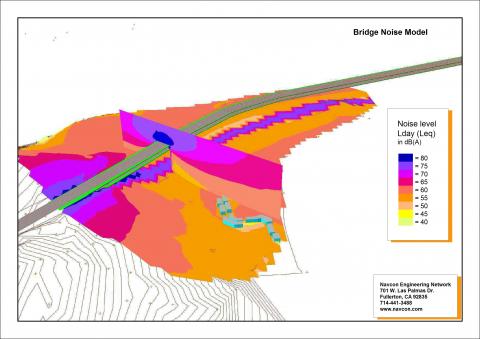
The graphics show the results computed with the SoundPLAN implementation of the FHWA TNM 2.5 version.
|
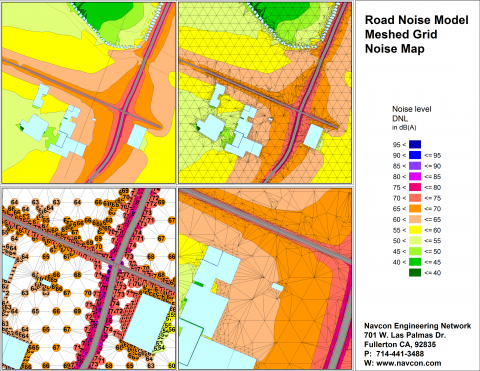 |
The graphic shows road noise model using a meshed contour calculation. The grid mesh is concentrated close to roads, barriers, buildings and opens up in area with free field propagation where the sound field is relatively in-active. |
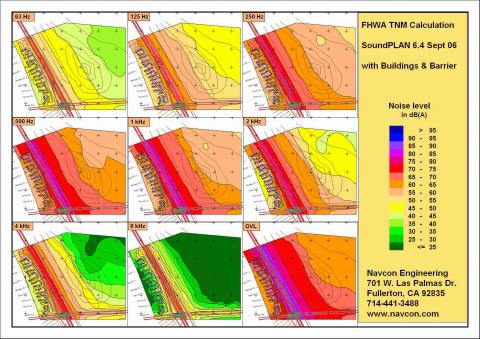 |
The graphics show spectral results computed with the SoundPLAN implementation of the FHWA TNM 2.5 version. The graphic indicate that the 250 Hz to 2 kHz octave bands are significant contributors to the overall noise impact.
|