|
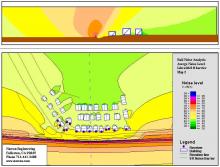
Navcon Engineering optimized a noise barrier along an existing Light Rail System. As part of the noise study Navcon investigated multiple noise mitigation measures such as skirts over the train wheels, short barriers that primarily reduced the train wheels noise and regular noise barriers. A 3D model was developed using the acquired noise data to calibrate the model. The noise levels were computed over a calculation area. The results are contoured [High sound levels : red / blue color Lower sound levels: yellow / green colors]. |
|
The noise contour maps show: The contour map on the bottom shows the scenario with a 8 ft absorptive noise barrier along the Light Rail System.
The noise maps (lower site map, upper cross section map) svisualize the noise propagation on both sides of the track. The noise barrier and the buildings are effective as reflective surfaces and also as noise barriers. The shielding effect of the 8 ft noise barrier provided 8 to 10 dB noise reduction behind the barrier. |
|
|
|
|

